Social Media Belief Dynamics
// Quick Summary
- Developed data mining tools to source millions of social media posts from Twitter, Reddit, Instagram, and TikTok
- Applied psychologically-focused data science methods to social media behavior
- Used NLP and network science to model how belief dynamics about political events unfold at scale
- Published research and open-source data science tools on belief dynamics, political organizing, and narrative framing
What the Research Explores
Across numerous research articles published in psychology, computer science, and data science venues, and alongside an outstanding web of collaborators spanning the social sciences to applied mathematics, I've developed novel data science paradigms and methods for analyzing collective behavior in social media environments. I focus analysis on online behavioral dynamics resulting from real-world (i.e., offline) events.
A full list of publications is available on my Google Scholar. I describe two key papers about political networking on Twitter at the links above.
Why It Matters
Online platforms shape how people frame issues, spread conspiracies, and mobilize. Understanding how beliefs and narrative interaction dynamics unfold on social media websites is essential for improving social communication on the internet.
- Research: Identify cognitive, social, and digital features like hypercoherence and echo chambers that drive content virality.
- Applications: Enable journalists, NGOs, and platforms to detect toxic behavior and foster pro-social engagement using real-time narrative analysis.
How the Research Is Done
- Data Collection: Use custom software to stream social media data preceding and following socially-discussed, real-world events.
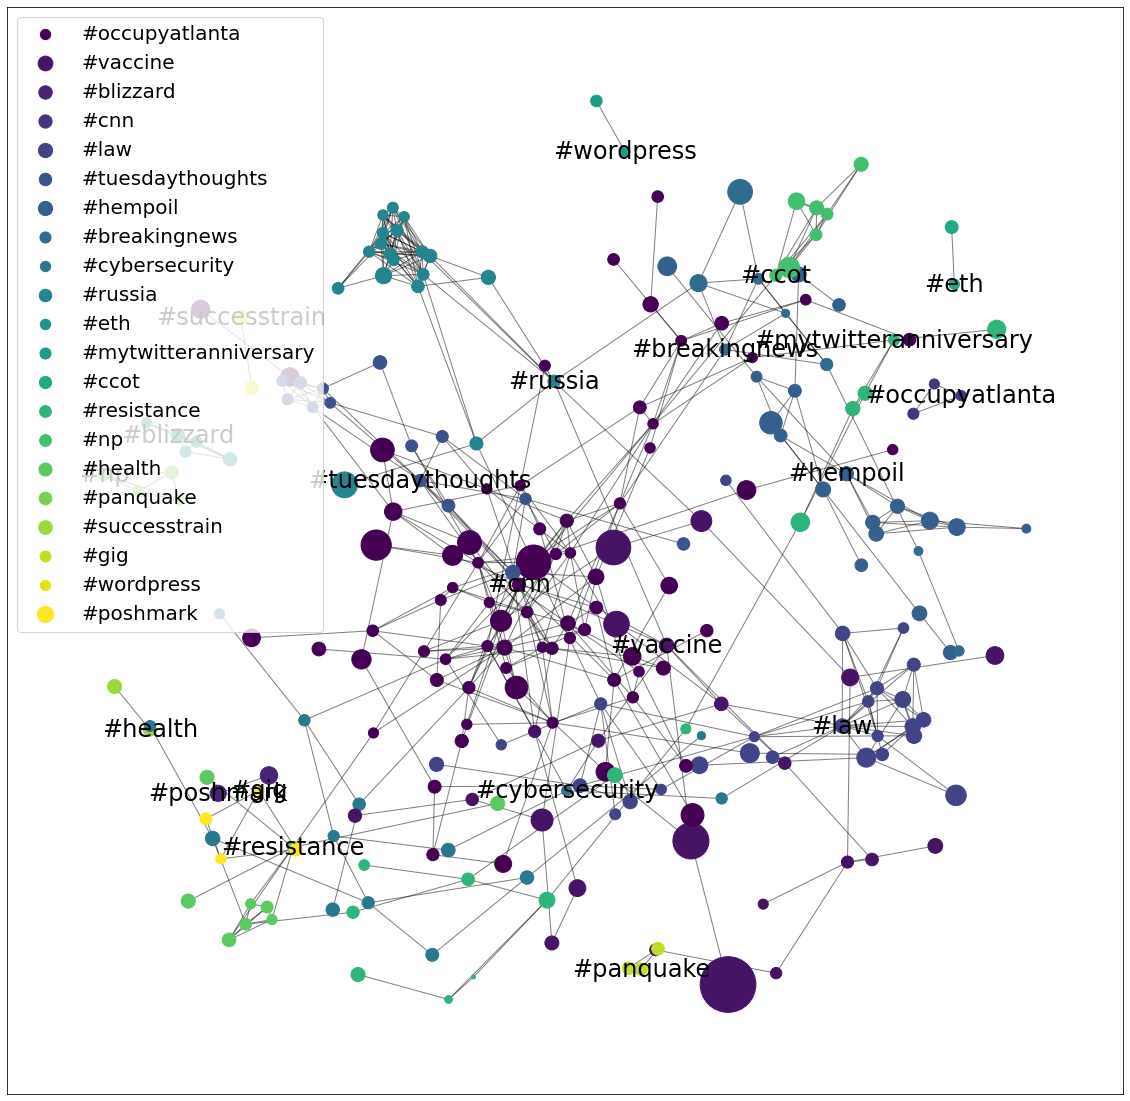
- Network Modeling: Build retweet and follower networks to identify central nodes and pathways that spread content.
- Content Analysis: Apply NLP techniques including topic modeling and neural embeddings to detect narrative clusters (e.g., good vs. evil in QAnon) in social media content.
- Behavioral Dynamics Modeling: Apply statistical methods including time-series analysis and multi-level models to measure how narratives and content dynamics shift in response to key events.
- Community and Belief Detection: Use semantic and network clustering and dimensionality reduction to visualize belief communities (organizing groups, echo chambers).
- Insight Generation: Develop novel visualization techniques that reduce data complexity to deliver actionable results to researchers, government partners, and industry stakeholders.